
Every manufacturing facility has different stages between raw material and finished commercial product. These different stages have individual motor circuit control (MCC) units, supplied from the ACB in primary control panel. Energy consumed by each area of a manufacturing plant can thus be calculated through regular monitoring. With production data, the energy consumed at any stage during the process can be normalized on units of production at the same stage. Performing this exercise continuously with a fixed time frequency will give a relation between units of production and energy consumed. Such production and energy correlation can be used by the top management to do bottom line analysis on how to improve the overall productivity while keeping the energy cost low.
Taking the time frequency of 1 hour, energy consumed in 1 hour window and number of units produced during the same period can be accounted. This will give 24 windows for one day but we also have to take plant shut hours into consideration as during these times, it can result in erroneous readings. Analysis of energy/unit for these 24 windows will give us the time of day during which more energy is being consumed. Looking deeper into such hours and capturing the root cause will lead to trapping energy wastages and will improve plant efficiency.
Doing such an analysis on regular basis, a baseline can be drawn for the whole manufacturing cycle. After attending the initial variation in energy consumed per unit at different time windows and achieving the best possible number for each time, the mean and standard deviation for each window can be taken as its baseline. Using this baseline, any deviation from it can be recorded to take counter measures.
At Zenatix, we integrate the energy meters of the facility with our software system which can record high resolution power data. Energy consumed within a 1 hour window can then be calculated on an on-going basis. Additionally, Zenatix platform can take the production data, which can either be provided in the form of excel file records uploaded through web interface or directly collected by interfacing with the machines that are capable of communicating with standard open protocols. Correspondingly, energy per unit can be calculated for 24 windows of the day.
Sample Plot-
Based on the analysis mentioned, plot of the energy consumed for producing one unit is plotted on hourly basis for 2 days. This analysis is done for one of the Zenatix’s client for the whole month. 24 such readings for all the days of a month will give a baseline. Considering loads other than only of machine which can be varying on hourly basis, baseline for each hour should be set separately. Taking average of 30 such readings for every hour in one month, the result can be used as the baseline for that hour for future considerations.
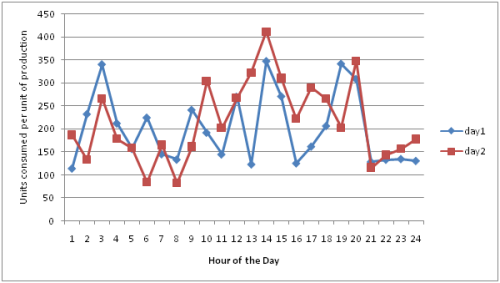
As is evident from the plot, energy per unit of consumption is not consistent across the day as well as in comparison with the baseline. This requires deeper analysis by the customer which is currently ongoing. Without this information the customer was just unaware if any such discrepancy exists and thus never sought out to find answers to why is this happening.